

Latest Version
Released:Oct 12, 2026
Description:
Single Installer Windows 64-bit PathTrace Version 4.0.1
SHA1 checksum value:
ae2d0cc9d3627ee25f4464ae2b0318f1944e2eb3
PathTrace
Continuous vulnerability assessment and system evaluation are essential in assuring that your facility’s physical protection system is functioning as designed and as required. But a checklist of guards and security technologies will not provide insight into system effectiveness, advise on potential upgrades, or consider adversary capabilities. To address these needs, Sandia National Laboratories developed PathTrace, a quantitative analysis modeling and simulation tool that uses established algorithms to identify system vulnerabilities.
What PathTrace Does
- Identifies the most vulnerable, quickest, and stealthiest paths using established algorithms to determine system vulnerabilities.
- Computes Probability of Interruption (PI), Probability of Detection (PD), Critical Detection Point (CDP), and Adversary Sequence Diagram (ASD) for each pathway.
- Creates actionable data that allows you to model and test security upgrades before costly installation and provides data-driven justification in support of changes.
- Allows you to test an infinite number of mitigation strategies for variables in detection, delay, and response.
How PathTrace Works
Build your Model- Use an aerial image of your facility taken from a diagram, blueprint, floor plan, or even a snip from Google Maps.
- Fill in delay barriers such as walls, doors, fences, gates, and windows that would stop the progress of the attacker.
- Define areas of detection, such as sensor volumes, patrolled zones, and camera coverage that would result in the detection of the attacker.
- Use facility testing data to specify the response team’s reaction time to a detection event.
- Specify what types of tools the adversary might carry and consider multiple varieties of tool kits.
- Generate and evaluate the quickest, stealthiest, and most vulnerable pathway to a target or target set.
- Consider multiple "what if" scenarios.
- Verify the effectiveness of an existing design.
- Study ideas for facility or technology upgrades, test their effectiveness, and justify costs before they are implemented.
PathTrace and Scribe3D: Better Together
Use PathTrace to analyze adversary pathways and how modifications in detection, delay, or response affect security at your facility, then export a simplified model into Scribe3D and create a tabletop exercise of the adversary attack pathway and your guard responses. Using both tools enables both quantitative and qualitative methods of system evaluation.
Downloadable Content
Lagassi
LPNPP (Lone Pine Nuclear Power Plant)
MTRF (Material Test Reactor Facility)
NSCM (Notional Simple Consecutive Model)
Release Notes
Version 4 Release Notes
Overview
PathTrace version 4 includes new capabilities, bug fixes, and enhancements to workflows. Changes were focused on the improvement of performance and the addition of two new features to improve user analysis workflows.
Note: If you are upgrading to Version 4 from a previous Version of PathTrace, please read and follow the associated Upgrade Guide to convert your existing models.
Delay, Detection, and Response Thresholds
Thresholds are a method for testing the sensitivity of a model to changes in response timeline, or delay/detection values of barriers. They are useful in determining a delay, detection, or response value that will push a scenario over a specified PI “threshold”.
Ultimately, this feature answers the question of…
- What is the maximum response time the system can handle while achieving a goal PI?
- What is the minimum delay or PD of a boundary the system can handle while still achieving a goal PI?
A simple example for the response case, if we were trying to achieve a PI ≥ 0.7 for a scenario, the threshold feature would answer the question: “What is the maximum response time the system can handle that still achieves a PI ≥ 0.7, where even one second longer would result in a PI < 0.7?”
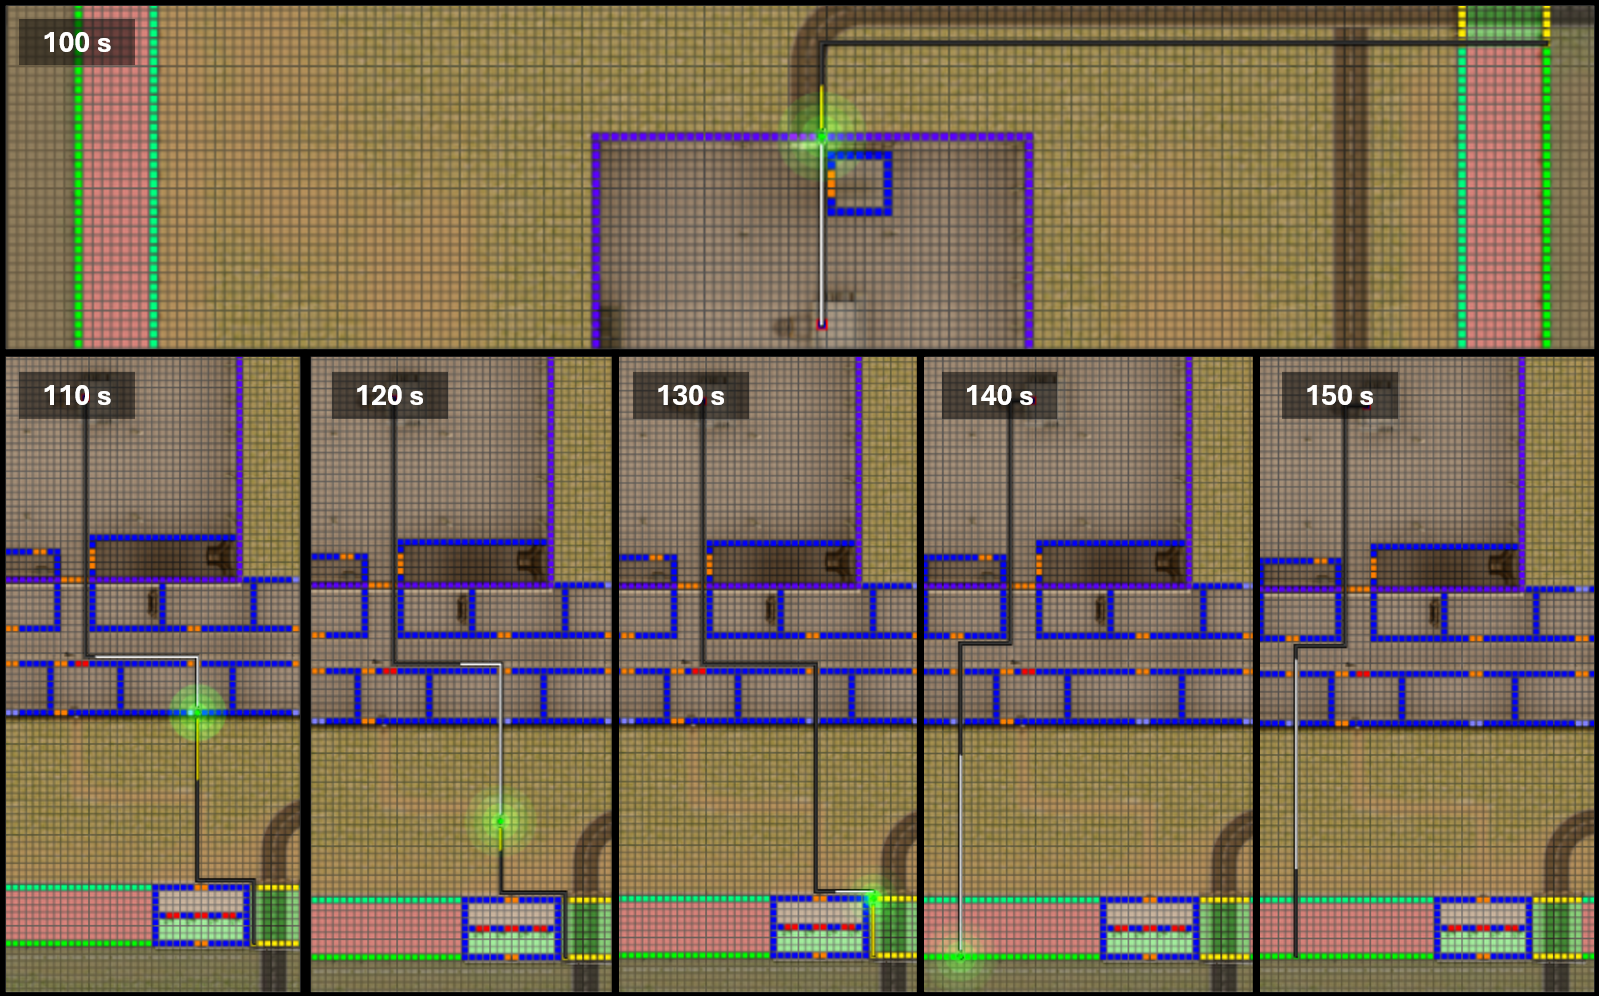
For example, using the response threshold feature, you can test the MVP outputs of a model for response values between 100s and 150s with 10s increments (100, 110, 120, ...150) and determine how PI responds. Since a lower response time will yield a PI greater than or equal a higher response time, you expect to see higher PI at 100s than at 150s. If a specific PI was of interest, say 0.5, you could determine the maximum response time that would result in a PI ≥ 0.5.
In the case of the example below.
- The response time of 130s has a PI ≥ 0.5
- The response time of 140s has a PI < 0.5
This can be seen visually in the pathway as the CDP in the 130s case is after the fence detection measures, where the 140s case places the CDP at the boundary fence before any detection is accumulated.
Thresholds are used in PathTrace by the following steps:
- Select “Analysis” mode on the left side mode selector
- Click the “View Parameters” button on the right side of the screen
- Under the Analysis dropdown, select one of three options…
- Response Threshold
- Delay Threshold
- Detection Threshold
- In the Active Parameters window, fill out the following details:
- Minimum – the lower boundary delay, PD, or response value to be tested
- Maximum – the upper boundary delay, PD, or response value to be tested
- Path Increment - the increments of values tested between the min and max
- Goal PI – the PI boundary the user is interested in finding the threshold for
- Click Apply
- (In the Delay or Detection Threshold Case) Select the barriers to be included in the threshold calculation. Selected barriers will highlight in white as shown below:
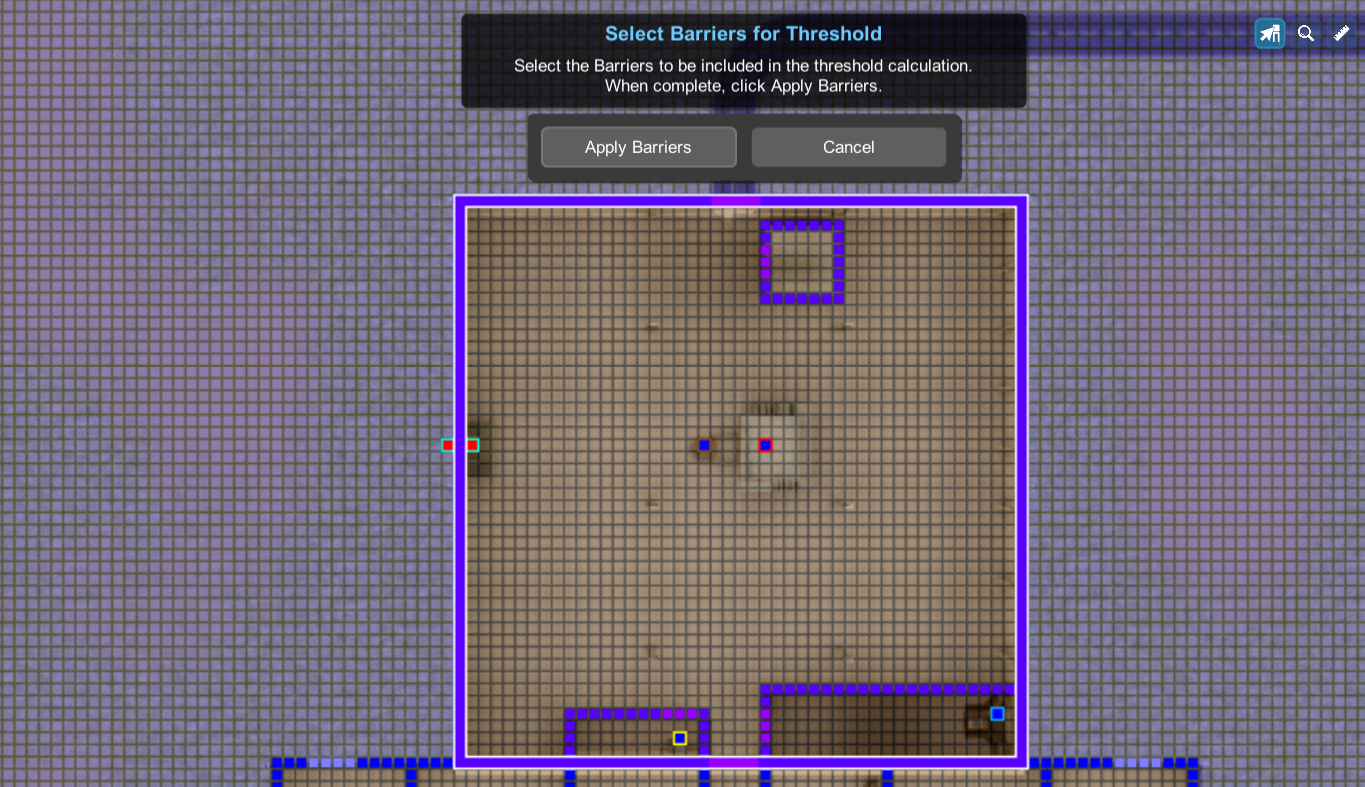
- (In the Delay or Detection Threshold Case) Click Apply Barriers
- Run a quickest, stealthiest, or most vulnerable pathway
- On the bottom of the screen, click “Range Summary”
- Locate the threshold value, highlighted in blue as the point where the goal PI is last reached
Logic Target Sets
Logical Target Sets are used to apply logical operators and grouping to target sets for more complex evaluation. This feature sees the addition of AND/OR logic and grouping targets together in target sets to reduce the number of target sets that need to be created to describe scenarios.
Below is an example of a Sabotage target set where the adversary must…
- Either sabotage the cooling tanks or take over the control room, then
- Either sabotage the reactor or the spent fuel pool
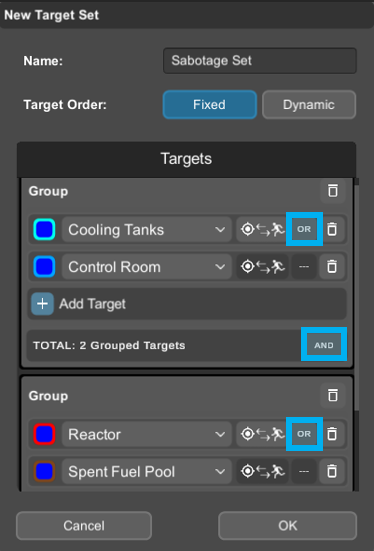
In logical terms, this can be written as…
(Cooling ∨ Control) ∧ (Reactor ∨ Spent Fuel)
Which in turn can evaluate out to four different possibilities for a fixed target set…
- Cooling Tanks + Reactor Sabotage
- Control Room + Reactor Sabotage
- Cooling Tanks + Spent Fuel Sabotage
- Control Room + Spent Fuel Sabotage
For a dynamic target set, this extends to ignore ordering, and the following four possibilities are considered…
- Reactor + Cooling Tanks Sabotage
- Reactor + Control Room Sabotage
- Spent Fuel + Cooling Tanks Sabotage
- Spent Fuel + Control Room Sabotage
Where a user would previously have needed to create 4-8 target sets to represent all of these cases, the logic target sets feature reduces the overhead to only having to create one target set. When the user navigates to analysis mode, any pathway that is generated with this target set will attempt all possible sub-pathways and output the most optimal one. In the case of the MVP, PathTrace will try every path and output the lowest PI path.
Model Variant Duplication
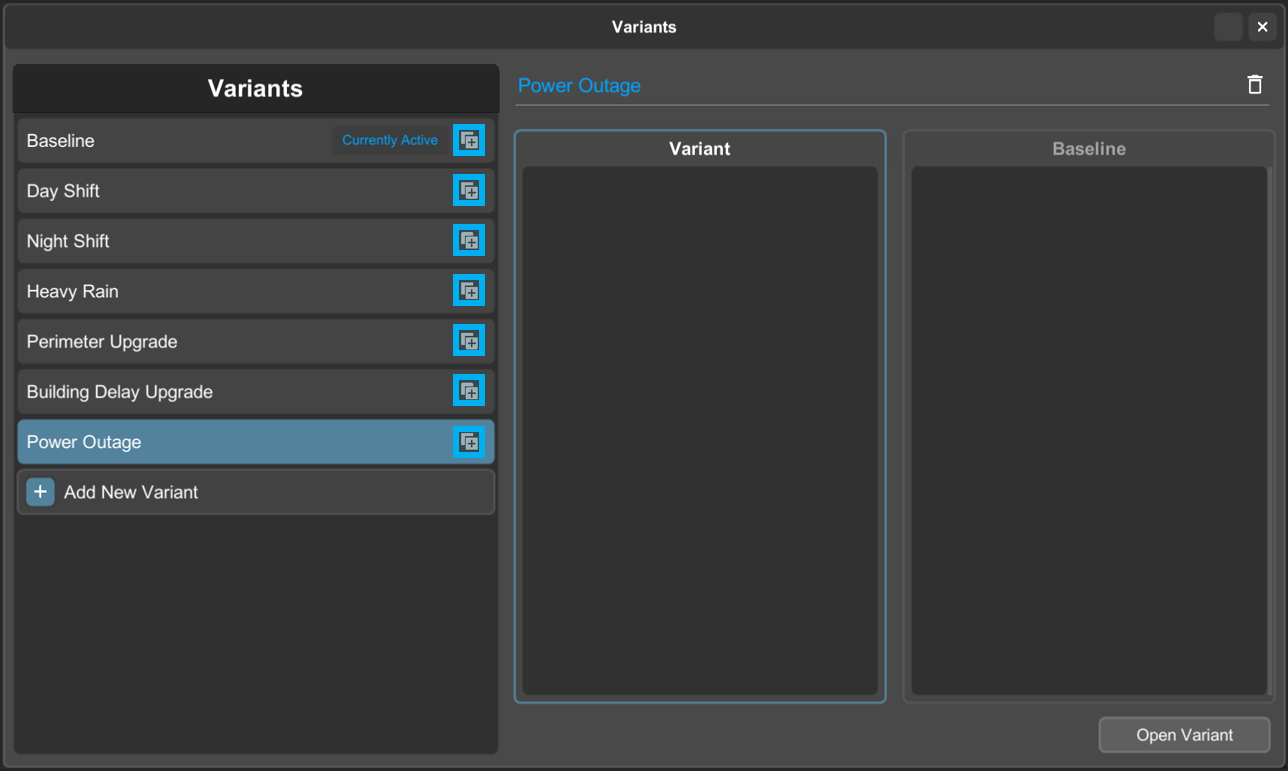
Instead of only being able to split variants off of the baseline, users can now duplicate variants they have created using the duplication button added to the variants window. This button will allow users to copy all the actions they made under a previous variant onto a new variant under a new name, which will be useful in analyzing sub-variants of a variant.
Display Settings
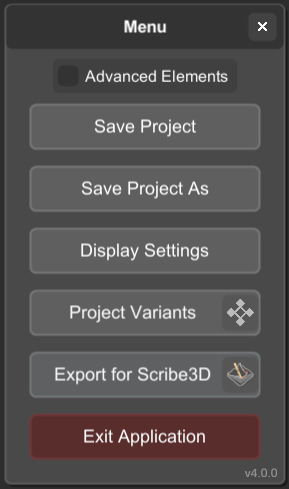
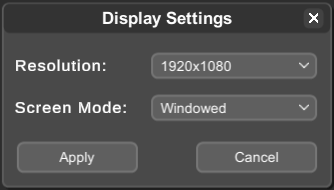
Full screen and windowed mode are now options available to the user alongside screen resolution adjustments. These settings are accessed by pressing the ESC key and clicking “Display Settings” in PathTrace. Once windowed, the PathTrace window is resizable by clicking and dragging on any corner or side.
Bulk Job Mode Refresh
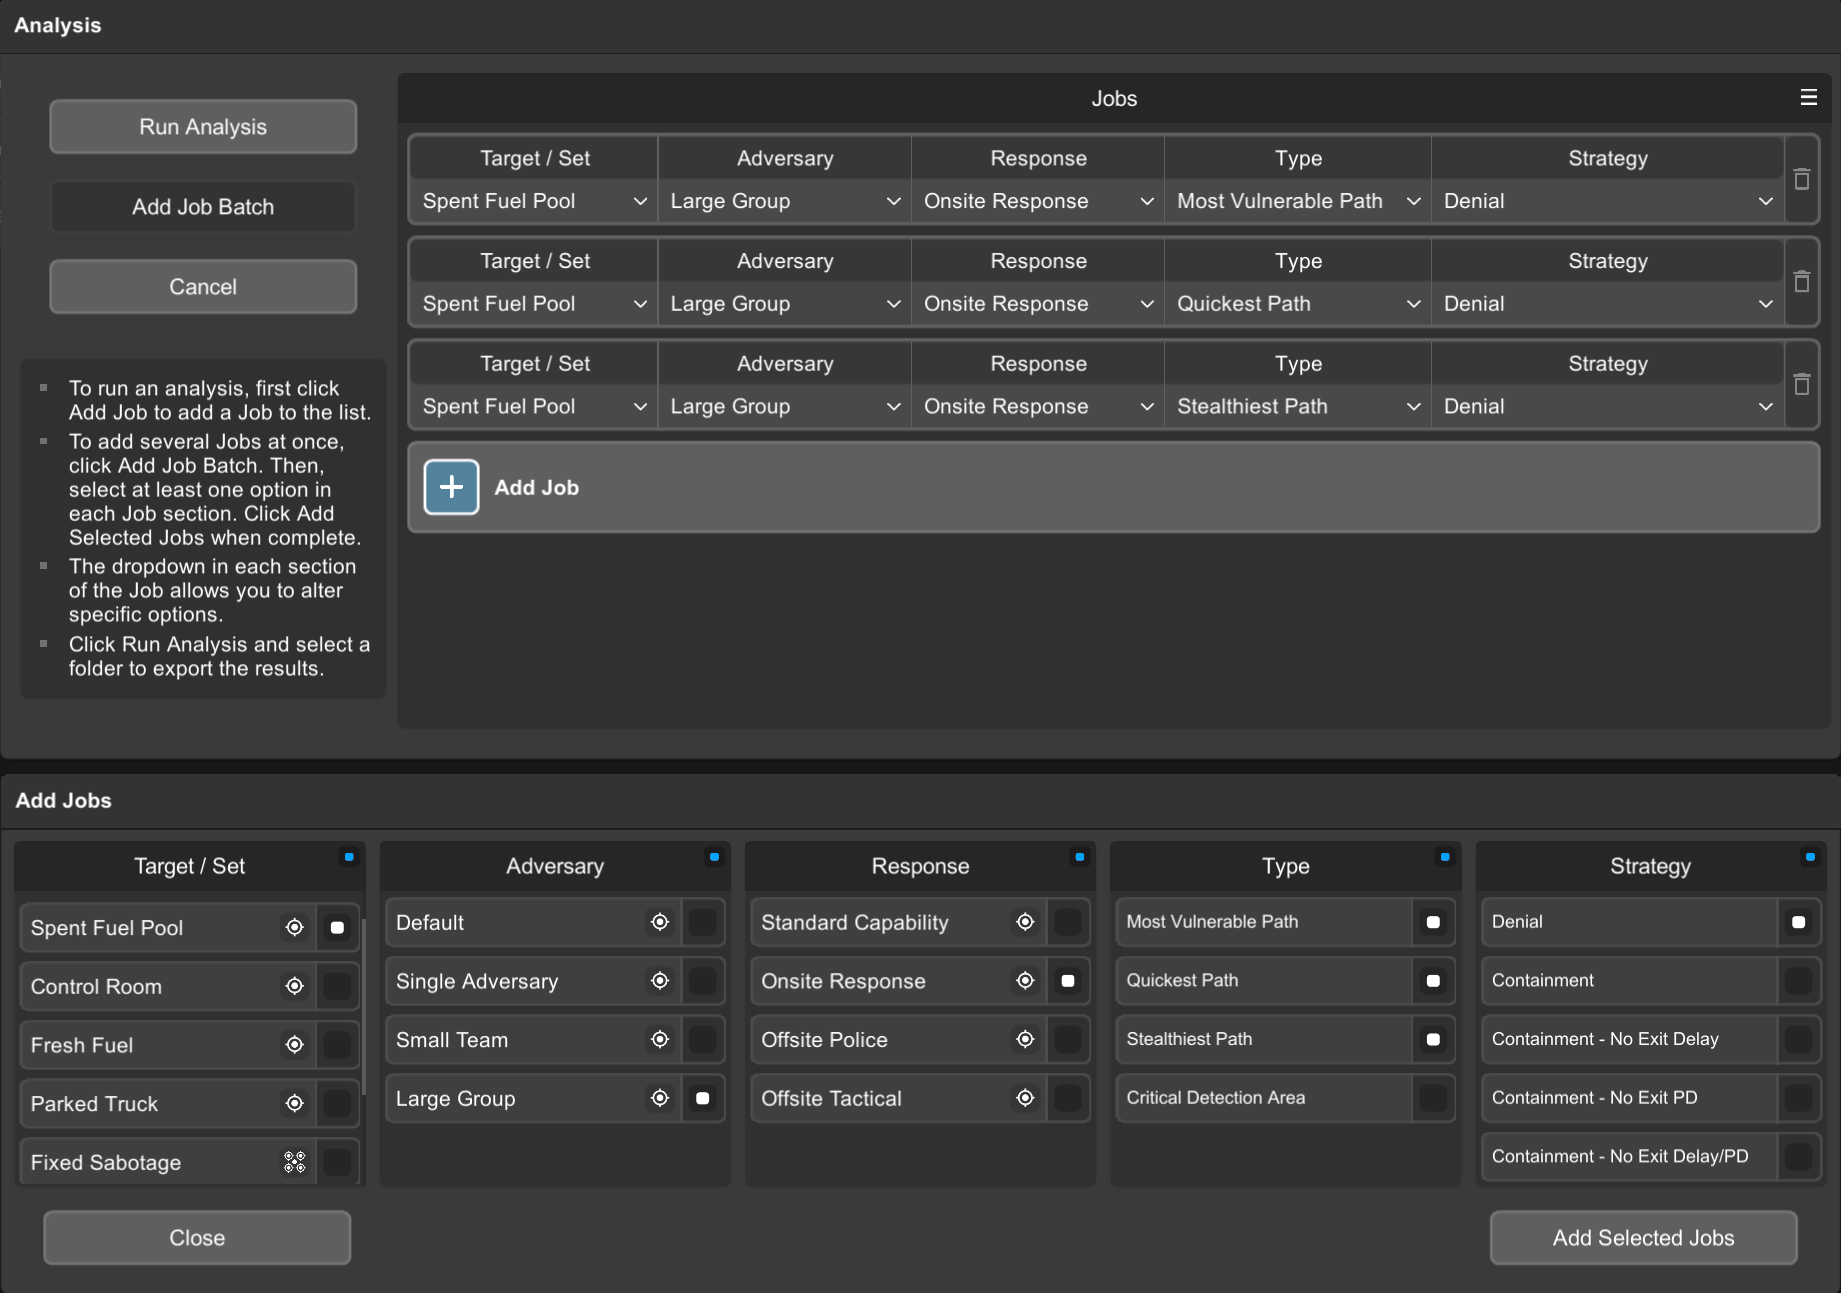
The user interface of the bulk jobs mode has been refreshed, including the following updates:
- All jobs in the jobs queue have dropdowns that are changeable
- The Add Job button now adds a single, modifiable job to the jobs queue
- The Add Job Batch button opens the job parameter selector at the bottom
The output of bulk jobs has also been refreshed to include information organized in a more digestible format.
Other Notable Improvements
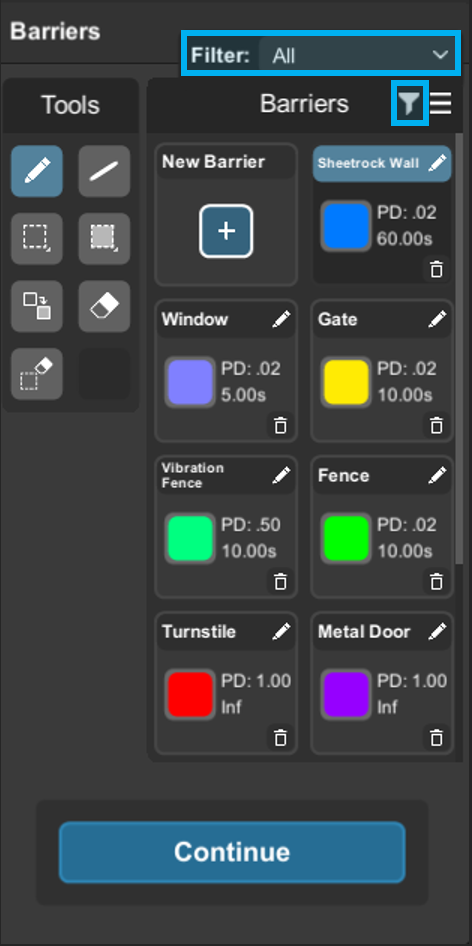
- Filter barrier by category added to better organize the barrier pallet in barriers mode and new barrier/detection area button moved to the top of the pallet
- Icons added to better describe equipment
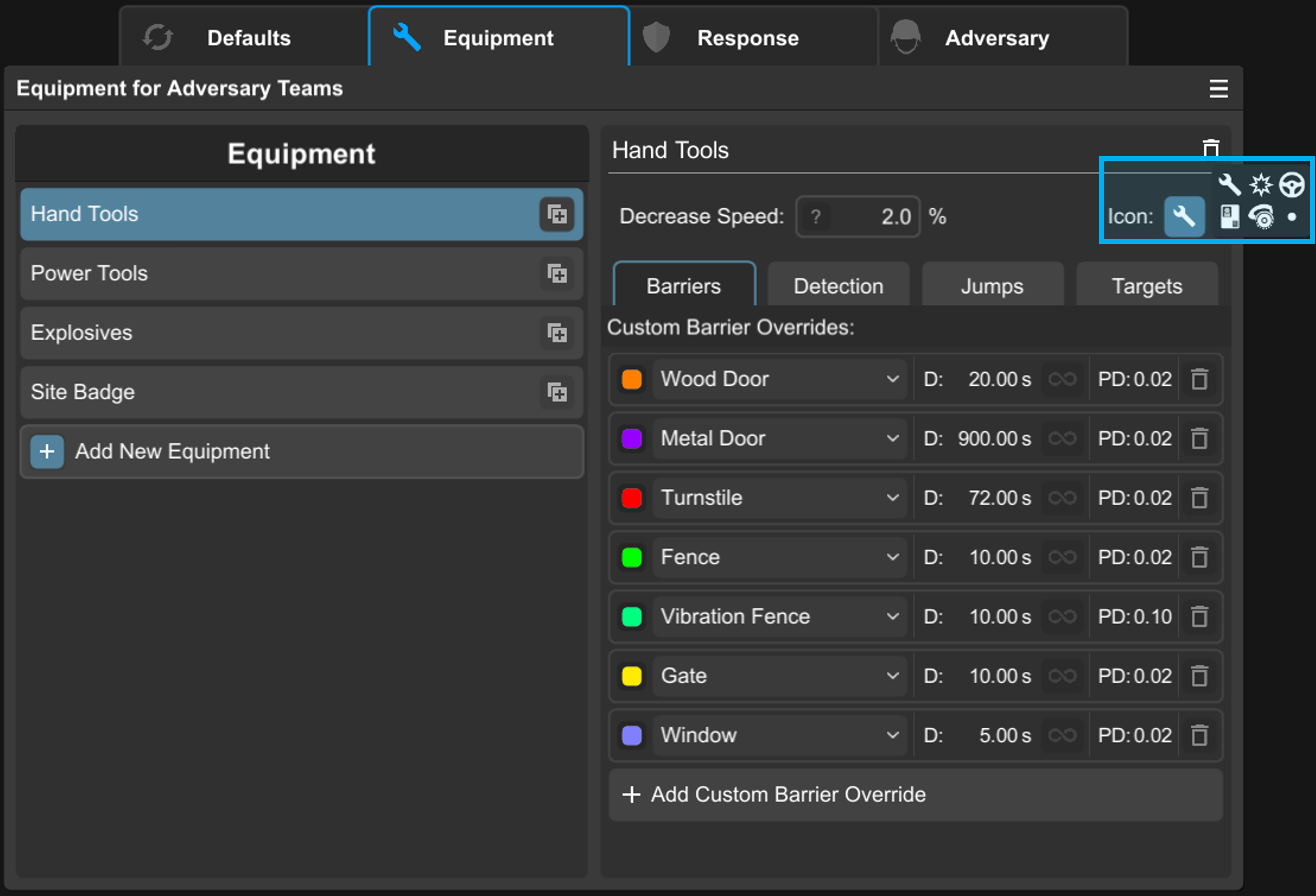
- Tab icons added for capability mode

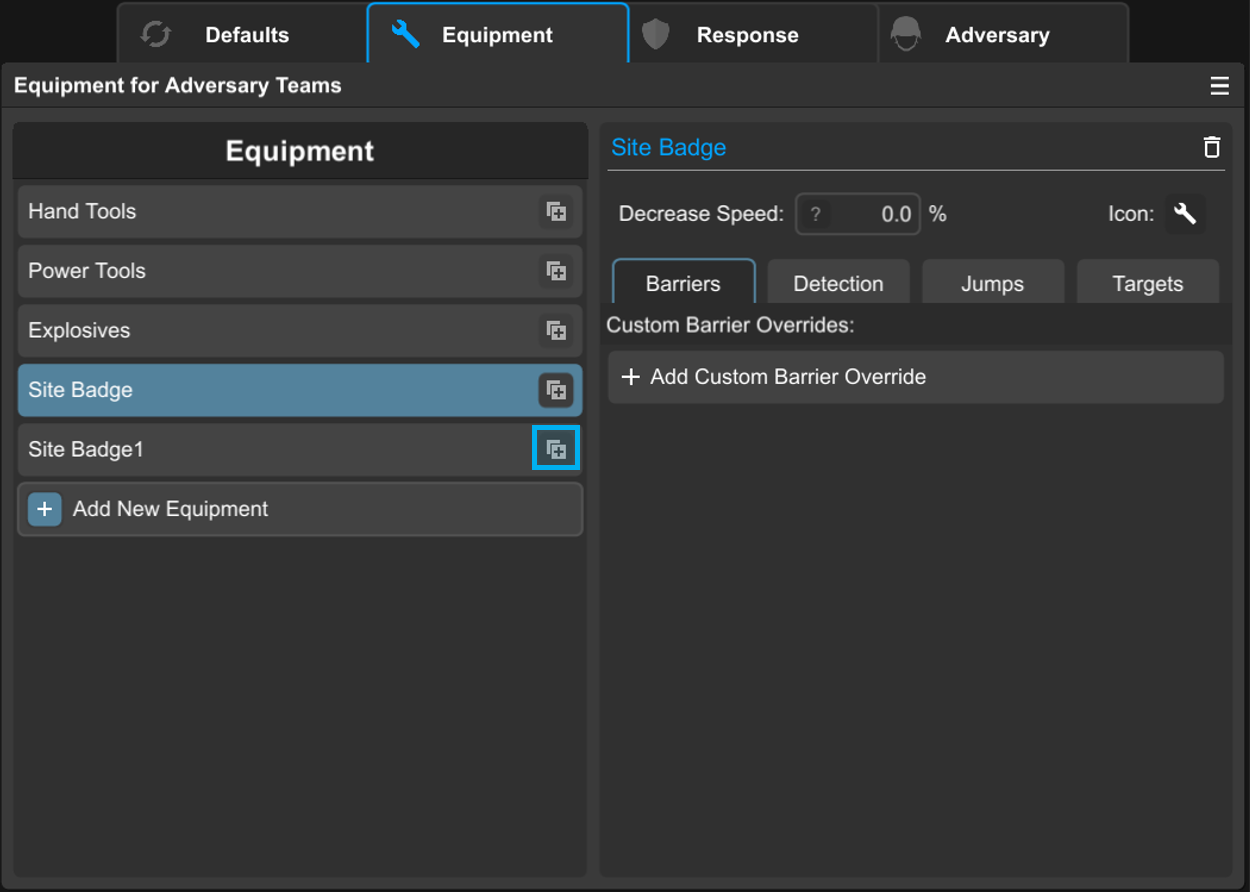
- Equipment can be duplicated
- Added ALT+UPARROW and ALT+DOWNARROW as shortcuts to switching levels
Bug Fixes
- Improved error detection for excel import related errors
- Addressed various corner-case issues identified in 2025 with complex pathways
- Addressed various issues with the undoing of barriers
- Fixed issue where drawing a barrier over a jump causes an error
- Fixed issue where analysis visuals do not load unless the mouse pointer is not on the UI
- Fixed issue where switching levels mid-scaling does not stop the scaling
- Fixed issue where switching from one multi-level project to another breaks the level switcher
- Fixed issue where adding equipment to adversaries could not be undone/redone
- Fixed issue where applying the group eraser to a barrier would ghost-highlight it after the fact
- Fixed issue where sometimes the pathway will walk through a jump without “jumping”
- Fixed issue where drawing a barrier and releasing the mouse over the UI does not commit the barrier
SAND2026-20074O
System Requirements
| Operating System | Windows 10 64-bit |
| Recommended Requirements | |
| CPU | Quad Core @ 3.6GHz or greater |
| GPU | Discrete Graphics Card – NVIDIA GEForce GTX1060, AMD Radeon RX 580 or better with at least 4GB VRAM |
| Memory | 16GB+ RAM |
| Disk Storage | 35GB+ Free |
SAND2025-07211W